To
...
Ask ranjit
- Enter url of the grafana in browser
- Select the dashboard to view resource.
- You can also import customized dashboard to monitor Adpetia application matrices.
- Steps (Ranjit)
Creating a Prometheus data source
To create a Prometheus data source in Grafana:
...
view the application metrices dashboard, you need to configure the data source in Grafana. In this case, Prometheus is the data source.
Configuring the data source in Grafana
Follow the instructions given below to configure the data source.
Log in to Grafana and configure the data source.
Info What would be the Grafana URL depends upon how you have exposed Grafana. - Click Configuration >> Data Sources.

- Click Add data source.
- On the Add data source page, select Prometheus as the type.
- Set the
...
- Prometheus server URL (
...
- For example,
http://
...
<Hostname>:
...
<Port>/).
...
- Configure the other data source settings
...
- based on your requirement (For example,
...
- selecting the
...
- authentication method).
...
- Click Save &
...
- test to save the new data source.
Creating a Prometheus graph
Follow the standard way of adding a new Grafana graph. Then:
- Click the graph title, then click "Edit".
- Under the "Metrics" tab, select your Prometheus data source (bottom right).
- Enter any Prometheus expression into the "Query" field, while using the "Metric" field to lookup metrics via autocompletion.
- To format the legend names of time series, use the "Legend format" input. For example, to show only the
methodandstatuslabels of a returned query result, separated by a dash, you could use the legend format string{{method}} - {{status}}. - Tune other graph settings until you have a working graph.
The following shows an example Prometheus graph configuration: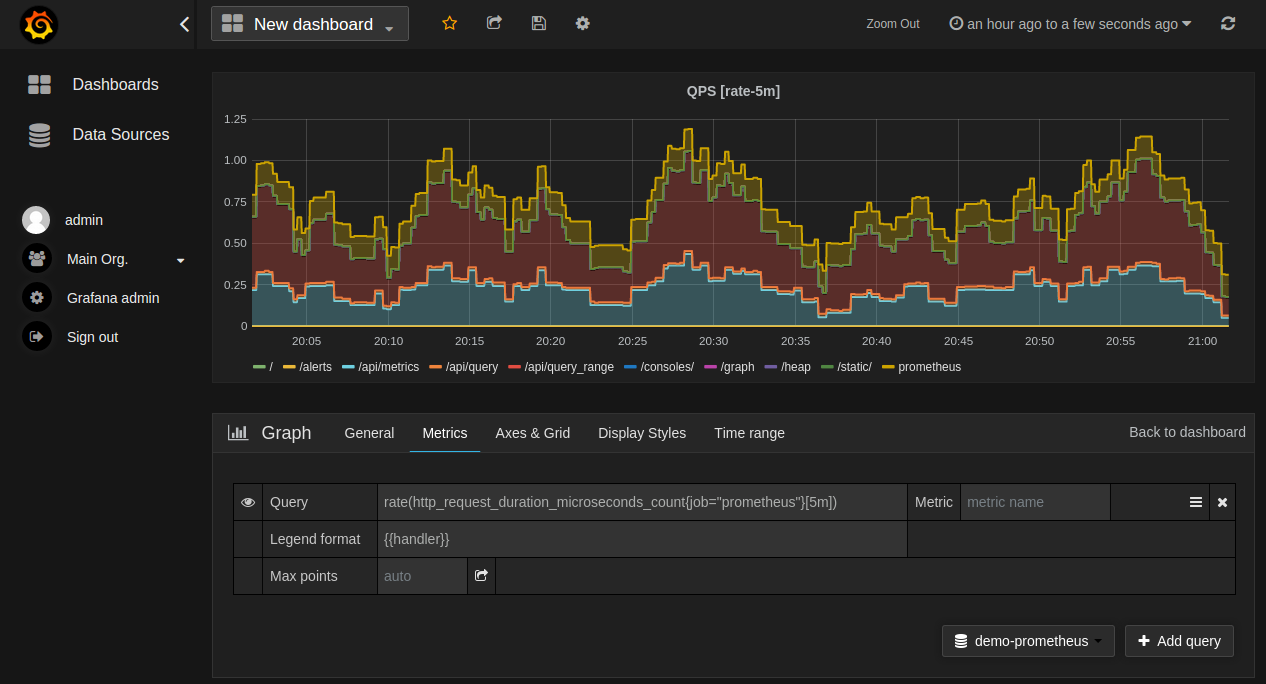
In Grafana 7.2 and later, the $__rate_interval variable is recommended for use in the rateand increase functions.
Importing pre-built dashboards from Grafana.com
Grafana.com maintains a collection of shared dashboards which can be downloaded and used with standalone instances of Grafana. Use the Grafana.com "Filter" option to browse dashboards for the "Prometheus" data source only.
You must currently manually edit the downloaded JSON files and correct the datasource: entries to reflect the Grafana data source name which you chose for your Prometheus server. Use the "Dashboards" → "Home" → "Import" option to import the edited dashboard file into your Grafana install.
...
| borderStyle | solid |
|---|---|
| title | You may be interested in... |
...
Once you have configured the data source, you can view the application metrices dashboards provided by Kubernetes.Anchor view dashboards view dashboards
To view the dashboards:
Click Search dashboards in the left panel.

The list of all the available dashboards appear under different heads, for example, Starred, Recent, etc.Tip You can also search for a specific dashboard by entering the name of the dashboard in the search bar. 
- Click the required dashboard on the list to view it.
The following screenshot is an example that shows the General/Kubernetes/Compute Resources/Cluster dashboard with relevant metrices.
Importing and viewing the custom Grafana dashboard
Adeptia provides a few dashboards in JSON format that you can import to view the application metrices. You can also customize these JSON files based on your requirement. Follow the steps given below to import the dashboard.
- Download the JSON file available here.
- Log in to Grafana.
- Go to Dashboards >> Browse.

- Click Import.
- On the Import page, click Upload JSON file to browse to and select the JSON file you downloaded in step 1.
- In the Options section, do the followings to import the dashboard.
- In the Name field, enter a name for the dashboard.
- In the Folder field, select a folder where you want to place the uploaded JSON file.
- In the Unique identifier (UID) field, provide a unique identifier (if required) to the dashboard.
- In the field next to Unique identifier (UID), select Prometheus as the data source.
- Click Import.
- Follow the steps given here to view the imported dashboard.
The following screenshot is an example that shows the Adeptia Graphs/Kubernetes Nodes dashboard with relevant metrices.
The following screenshot is an example that shows the Adeptia Graphs/Kubernetes Persistent Volumes usage dashboard with relevant metrices.